function generateData(config1)
{
	 for(var i = 0,lengthCountry = smCountryArr1.length;i < lengthCountry ;i++)
	 {
        var point = new SuperMap.Geometry.Point(parseFloat(smCountryArr1[i][1]),parseFloat(smCountryArr1[i][2])),
                strContent = new Array(smCountryArr1[i][0],smCountryArr1[i][3],smCountryArr1[i][4])
     }
		return (strContent);

}
config1={
        type: 'pie',
        data: {
            datasets: [{
                data:generateData(),
                backgroundColor: [
                    window.chartColors.red,
                    window.chartColors.orange,
                    window.chartColors.yellow,
                    window.chartColors.green,
                    window.chartColors.blue,
                ],
                label: 'Dataset 1'
            }],
            labels: [
                "Red",
                "Orange",
                "Yellow",
                "Green",
                "Blue"
            ]
        },
        options: {
            responsive: true,
            legend: {
                position: 'top',
            },
            title: {
                display: true,
                text: 'Chart.js Doughnut Chart'
            },
            animation: {
                animateScale: true,
                animateRotate: true
            }
        }

				}

function openwin3() {
        var ctx = document.getElementById("chart-holder").getContext("2d");
        window.myPie = new Chart(ctx, config1);
    };
运行结果如下:
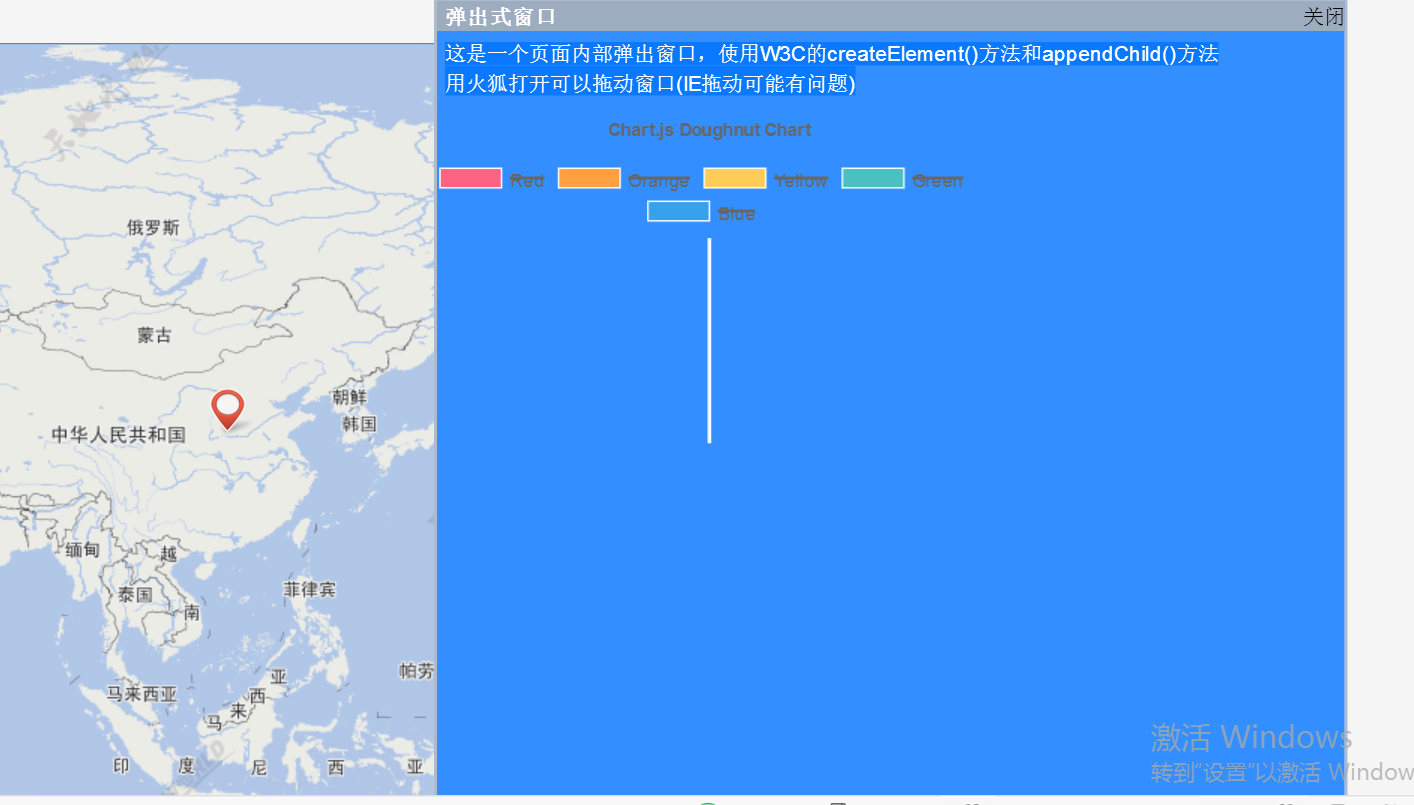 请问代码中的什么问题导致没有链接对应数据?