//添加标注
function createMarker(){
    for(var i = 0,lengthCountry = smCountryArr1.length;i < lengthCountry ;i++){
        var point = new SuperMap.Geometry.Point(parseFloat(smCountryArr1[i][1]),parseFloat(smCountryArr1[i][2])),
                strContent = new Array(smCountryArr1[i][0],smCountryArr1[i][3],smCountryArr1[i][4]),

                size = new SuperMap.Size(32, 32),//标记的大小
                offset = new SuperMap.Pixel(-(size.w / 2), -size.h),//标记的位置
                feature = new SuperMap.Feature(marker, new SuperMap.LonLat(point.x, point.y));
        feature.data.icon = new SuperMap.Icon("theme/images/cluster1.png", size, offset);
        var marker = feature.createMarker();
        var markerClick = function (evt,feature) {
            SuperMap.Event.stop(evt);
            this.win.open
			(feature/*,
			{
                "a":strContent[0],
                "b":strContent[1],
				"c":strContent[2]
            }*/);


        };
        marker.events.register("click", feature, function(feature)
		{
            return function(evt){
                markerClick(evt,feature);
            }
        }(feature));
        markers.addMarker(marker);
    }
}

this.win = new InfoWindow_z({"map":map});
function InfoWindow_z(param){
    var t = this;
    t.infowin = null;
    t.map = null;
    t.init = function(param){
        for(var key in param){
            t[key] = param[key];
        }
    }
    t.open = function(feature,data){

        t.create(feature,data);
    }

//打开窗口
t.create =
	function showWindow(){
  if(document.getElementById("divWin"))
  {
	  $("divWin").style.zIndex=999;
	  $("divWin").style.display="";
  }
  else
  {
	  var objWin=document.createElement("div");
	  objWin.id="divWin";
	  objWin.style.position="absolute";
      objWin.style.width="605px";
	  objWin.style.height="975px";
	  objWin.style.left="550px";
	  objWin.style.right="300px";
	  objWin.style.top="0px";
	  objWin.style.border="2px solid #AEBBCA";
	  objWin.style.background="#FFF";
	  objWin.style.zIndex=999;
	  document.body.appendChild(objWin);
  }

  if(document.getElementById("win_bg"))
  {
	  $("win_bg").style.zIndex=998;
	  $("win_bg").style.display="";
  }
  else
  {
	  var obj_bg=document.createElement("div");
	  obj_bg.id="win_bg";
	  obj_bg.className="win_bg";
	  document.body.appendChild(obj_bg);
  }
   var str="";
  str+='<div class="winTitle" onMouseDown="startMove(this,event)" onMouseUp="stopMove(this,event)"><span class="title_left">弹出式窗口</span><span class="title_right"><a href="javascript:closeWindow()" title="单击关闭此窗口">关闭</a></span><br style="clear:right"/></div>';  //标题栏
  str+='<div class="winContent">这是一个页面内部弹出窗口,使用W3C的createElement()方法和appendChild()方法<br />  用火狐打开可以拖动窗口(IE拖动可能有问题)</div>';  //窗口内容
  str+='<div class="winContent"><input type="button" onclick="openwin3()" value="人口情况" /></div>';
  str+='<div id="canvas-helper" style="width:60%"><canvas id="chart-holder" /></div>';
  $("divWin").innerHTML=str;
}
	/*function(feature,data){
        var contentHTML = "<div style='font-size:.8em; opacity: 0.8; overflow-y:hidden;'>" +
                "<span style='font-weight: bold; font-size: 18px;'>详细信息</span><br>";
		contentHTML += "城市(国家)名:"+data.name+ "<br>";
		contentHTML += data.picture+"<br>";
        contentHTML += "简介:"+data.introduction+ "</div>";
        //初始化一个弹出窗口,当某个地图要素被选中时会弹出此窗口,用来显示选中地图要素的属性信息
        var popup = new SuperMap.Popup.Anchored("chicken",
                feature.marker.lonlat,
                new SuperMap.Size(300,200),
                contentHTML,
                null,
                true);
        feature.popup = popup;
        map.addPopup(popup);
        t.infowin = popup;
    }*/

}
for(var i = 0,lengthCountry = smCountryArr1.length;i < lengthCountry ;i++){
        var point = new SuperMap.Geometry.Point(parseFloat(smCountryArr1[i][1]),parseFloat(smCountryArr1[i][2])),
                strContent = new Array(smCountryArr1[i][0],smCountryArr1[i][3],smCountryArr1[i][4]),
//var dataset1=[23,78];
config1 = {
        type: 'pie',
        data: {
            datasets: [{
                data:strContent,
                backgroundColor: [
                    window.chartColors.red,
                    window.chartColors.orange,
                    window.chartColors.yellow,
                    window.chartColors.green,
                    window.chartColors.blue,
                ],
                label: 'Dataset 1'
            }],
            labels: [
                "Red",
                "Orange",
                "Yellow",
                "Green",
                "Blue"
            ]
        },
        options: {
            responsive: true,
            legend: {
                position: 'top',
            },
            title: {
                display: true,
                text: 'Chart.js Doughnut Chart'
            },
            animation: {
                animateScale: true,
                animateRotate: true
            }
        }
    }}


</script>


  <script>
	//
     function openwin3() {

        var ctx = document.getElementById("chart-holder").getContext("2d");
        window.myPie = new Chart(ctx, config1);
    };

    </script>
<script>

function closeWindow(){
  $("divWin").style.display="none";
  $("win_bg").style.display="none";
}
function $(o){
  return document.getElementById(o);
}
function startMove(o,e){
  var wb;
  if(document.all && e.button==1) wb=true;
  else if(e.button==0) wb=true;
  if(wb)
  {
    var x_pos=parseInt(e.clientX-o.parentNode.offsetLeft);
    var y_pos=parseInt(e.clientY-o.parentNode.offsetTop);
    if(y_pos<=o.offsetHeight)
    {
      document.documentElement.onmousemove=function(mEvent)
      {
        var eEvent=(document.all)?event:mEvent;
        o.parentNode.style.left=eEvent.clientX-x_pos+"px";
        o.parentNode.style.top=eEvent.clientY-y_pos+"px";
      }
    }
  }
}
function stopMove(o,e){
  document.documentElement.onmousemove=null;
}
    </script>
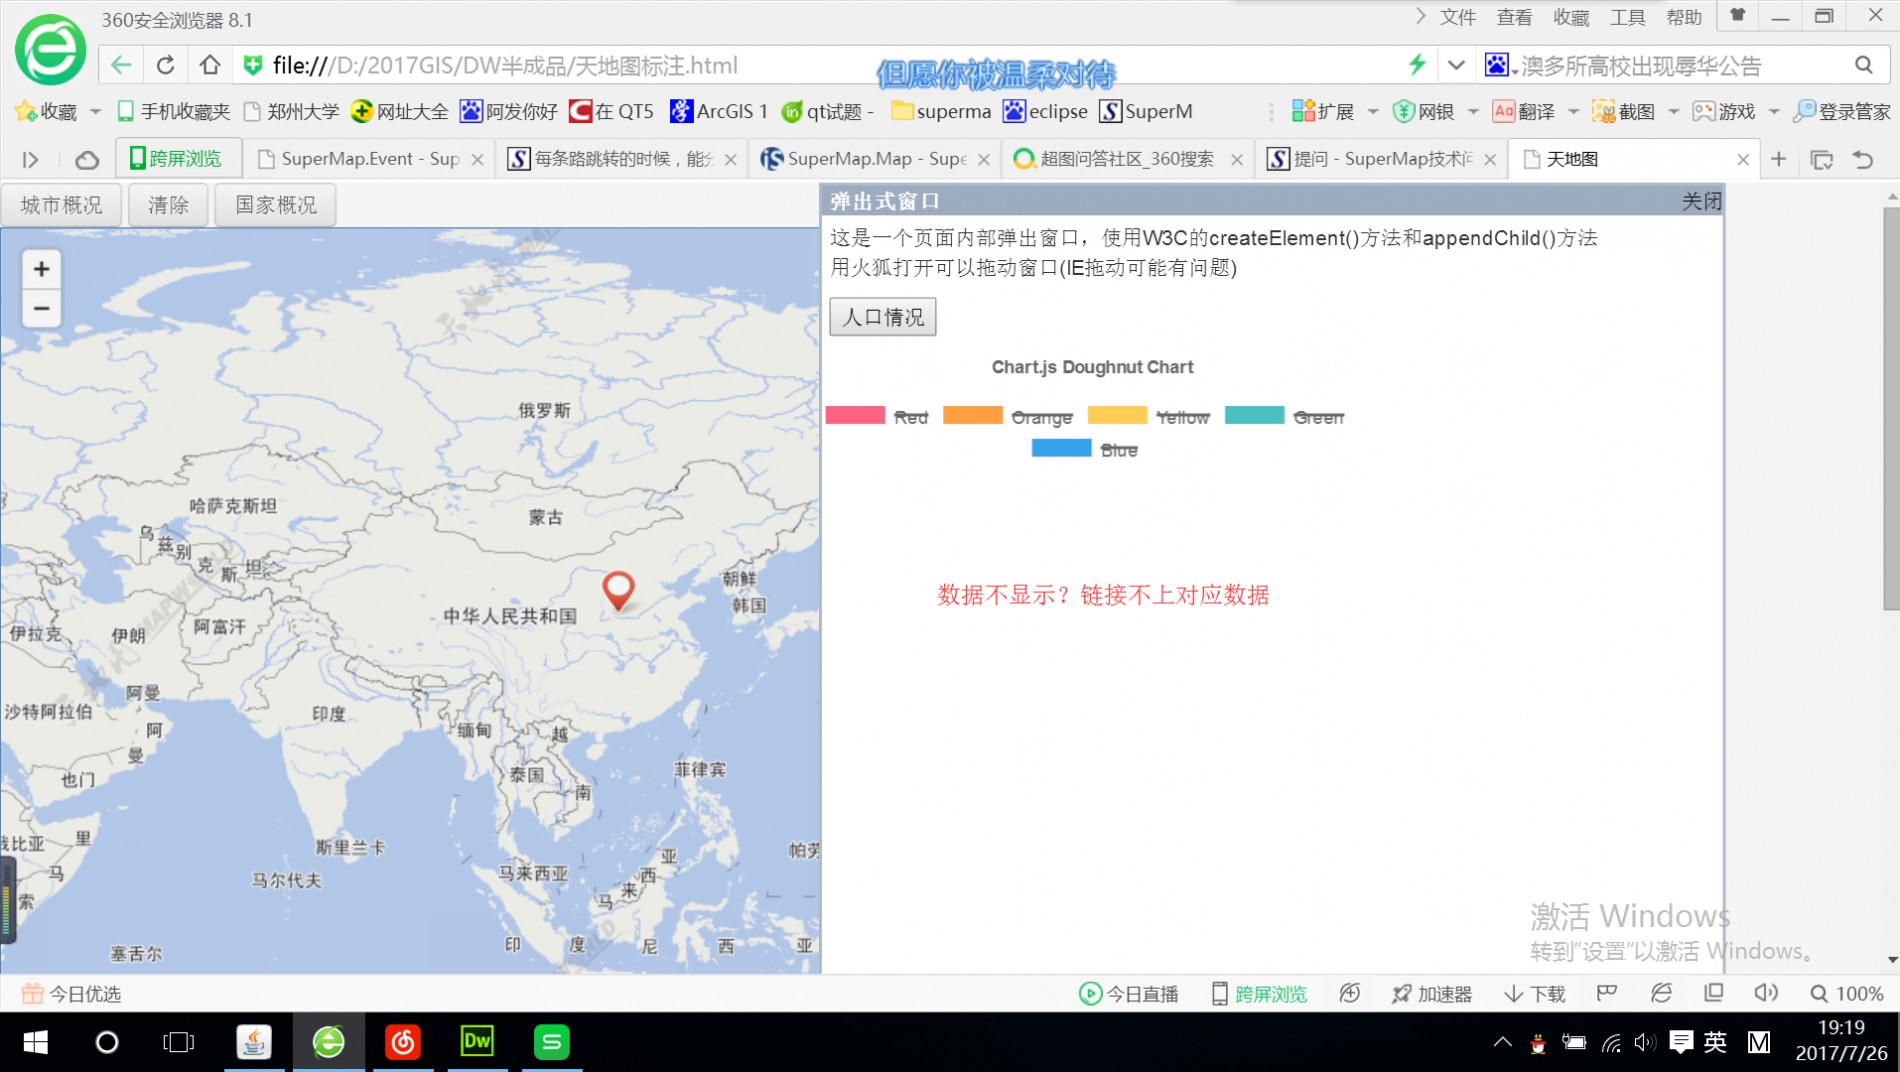
我通过通过每个点的经纬度作为区别依据,用多点标绘点击对应点弹出对应popup弹窗,
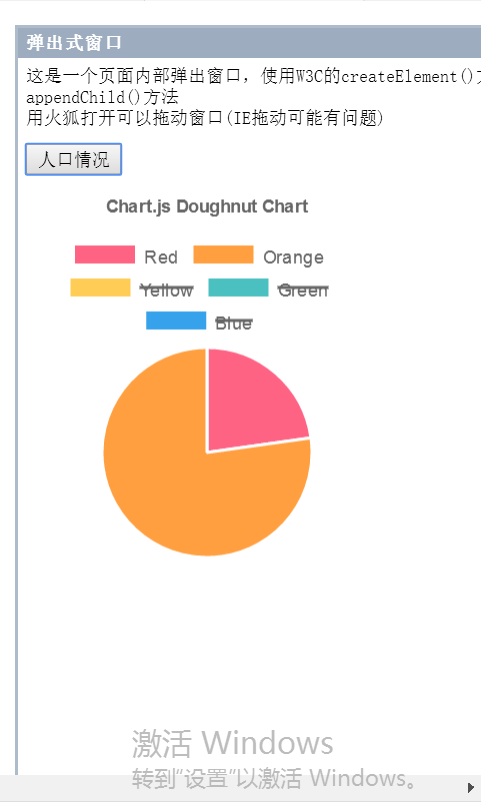
现在想用弹出显示饼状图的div窗口显示每个点的数据。不知懂啊该怎么让数据和点匹配。现在的运行结果是下面:
 正常该是显示数据,并是对应点的数据;

开头的代码我去掉了开头和结尾,请老师帮助。

 热门文章
热门文章


 热门文章
热门文章

