第一次点击一个图形可以进行绘制,当你点击其他图形绘制时就会报错???
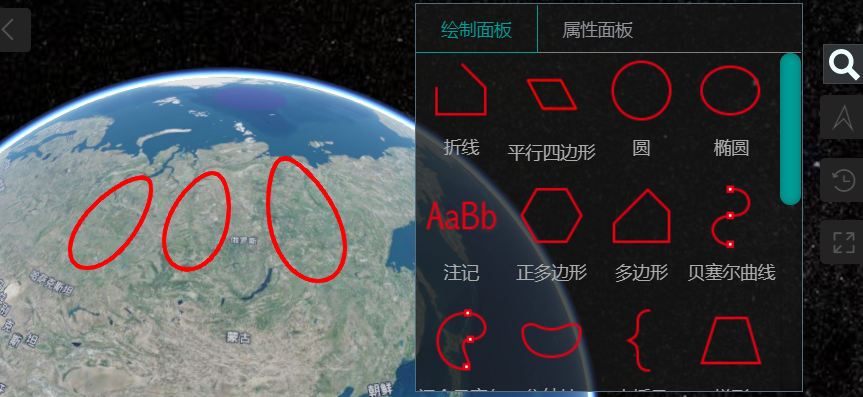
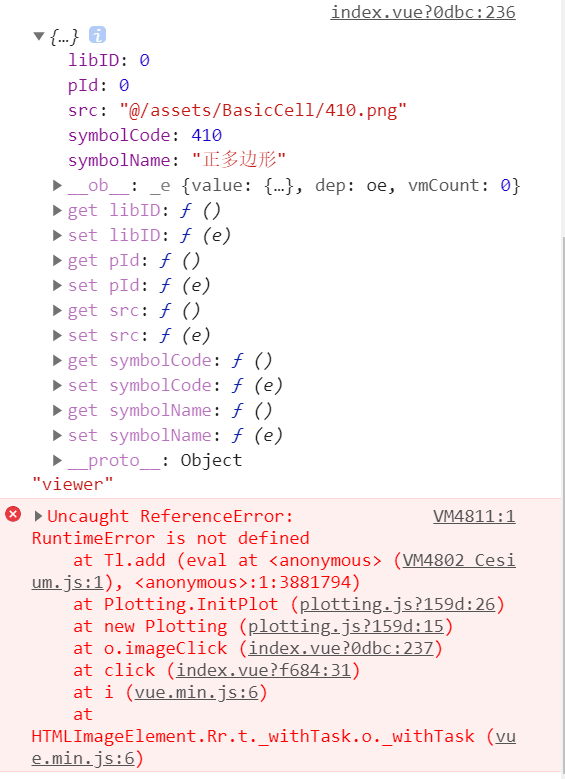
当第二次点击其他图形绘制时,就会报以下错:
在vue中我是给每张图片设置了监听事件:
methods:{
  // 图形监听事件
    imageClick(val) {
      var viewer=window.viewer;
      console.log(val,'viewer');
      const plotting = new Plotting(viewer);
      if (plotting) {
        plotting.DrawCellClick(val);
      }
    },
}
在js文件中我将开源中的方法都给提取了出来,自己进行了编写;
这是 plotting.js 文件中的代码:
class Plotting {
  constructor(viewer) {
    this.viewer = viewer;
    this.host = 'http://support.supermap.com.cn:8090';
    this.cesium = Cesium;
    this.scene = viewer.scene;
    this.scene.globe.depthTestAgainstTerrain = false;
    this.serverUrl = this.host + '/iserver/services/plot-jingyong/rest/plot';
    this.plotting;
    this.plottingLayer;
    this.plotEditControl;
    this.plotDrawControl;
    this.plotPanel;
    this.stylePanel;
    this.InitPlot();
  }
  InitPlot() {
    var self = this;
    if (!this.viewer) {
      return;
    }
    self.plottingLayer = new self.cesium.PlottingLayer(
      self.scene,
      'plottingLayer',
    );
    self.scene.plotLayers.add(self.plottingLayer);

    self.plotEditControl = new self.cesium.PlotEditControl(
      self.scene,
      self.plottingLayer,
    ); //编辑控件
    self.plotDrawControl = new self.cesium.PlotDrawControl(
      self.scene,
      self.plottingLayer,
    ); //绘制控件

    self.plotDrawControl.drawControlEndEvent.addEventListener(()=>{
      //标绘结束,激活编辑控件

      self.plotEditControl.activate();
    });

    self.plotting = self.cesium.Plotting.getInstance(
      self.serverUrl,
      self.scene,
    );
    //标绘面板
    // initPlotPanel("plotPanel", serverUrl, plotDrawControl, plotEditControl, plotting);
    // 属性面板
    // self.stylePanel = new StylePanel(
    //   'stylePanel',
    //   self.plotEditControl,
    //   self.plotting,
    // );
  }
  DrawCellClick(drawCellparam) {
    console.log(drawCellparam,'drawcell');
    console.log(this.plotDrawControl,'plotDraw');
    var self = this;
    if (self.plotDrawControl !== null) {
      self.plotDrawControl.deactivate();
      self.plotDrawControl.libID = drawCellparam.libID;
      self.plotDrawControl.code = drawCellparam.symbolCode;

      //设置标号默认的模型路径
      self.plotDrawControl.drawFinishEvent.addEventListener(function (geo) {
        if (geo.symbolType === SuperMap.Plot.SymbolType.DOTSYMBOL) {
          geo.modelPath = './SampleData/plot/Cesium_Air.gltf';
          geo.picturePath = './SampleData/plot/blupin.png';
        }
      });
      self.plotDrawControl.serverUrl = self.serverUrl;

      self.plotDrawControl.activate();
      if (undefined !== self.plotEditControl) {
        self.plotEditControl.deactivate();
      }
    }
  }
  //删除指定标号
  deleteSeleGeo() {
    var self = this;
    self.plottingLayer.removeGeoGraphicObject(
      self.plottingLayer.selectedFeature,
    );
  }
  //获取属性面板GridDom
  getGridDomObdect() {
    var self = this;
    return self.stylePanel.getDomObject();
  }

  //     // 想要通过该方法来暴露x
  //     showX () {
  //         return this.x
  //     }
}
export default Plotting;