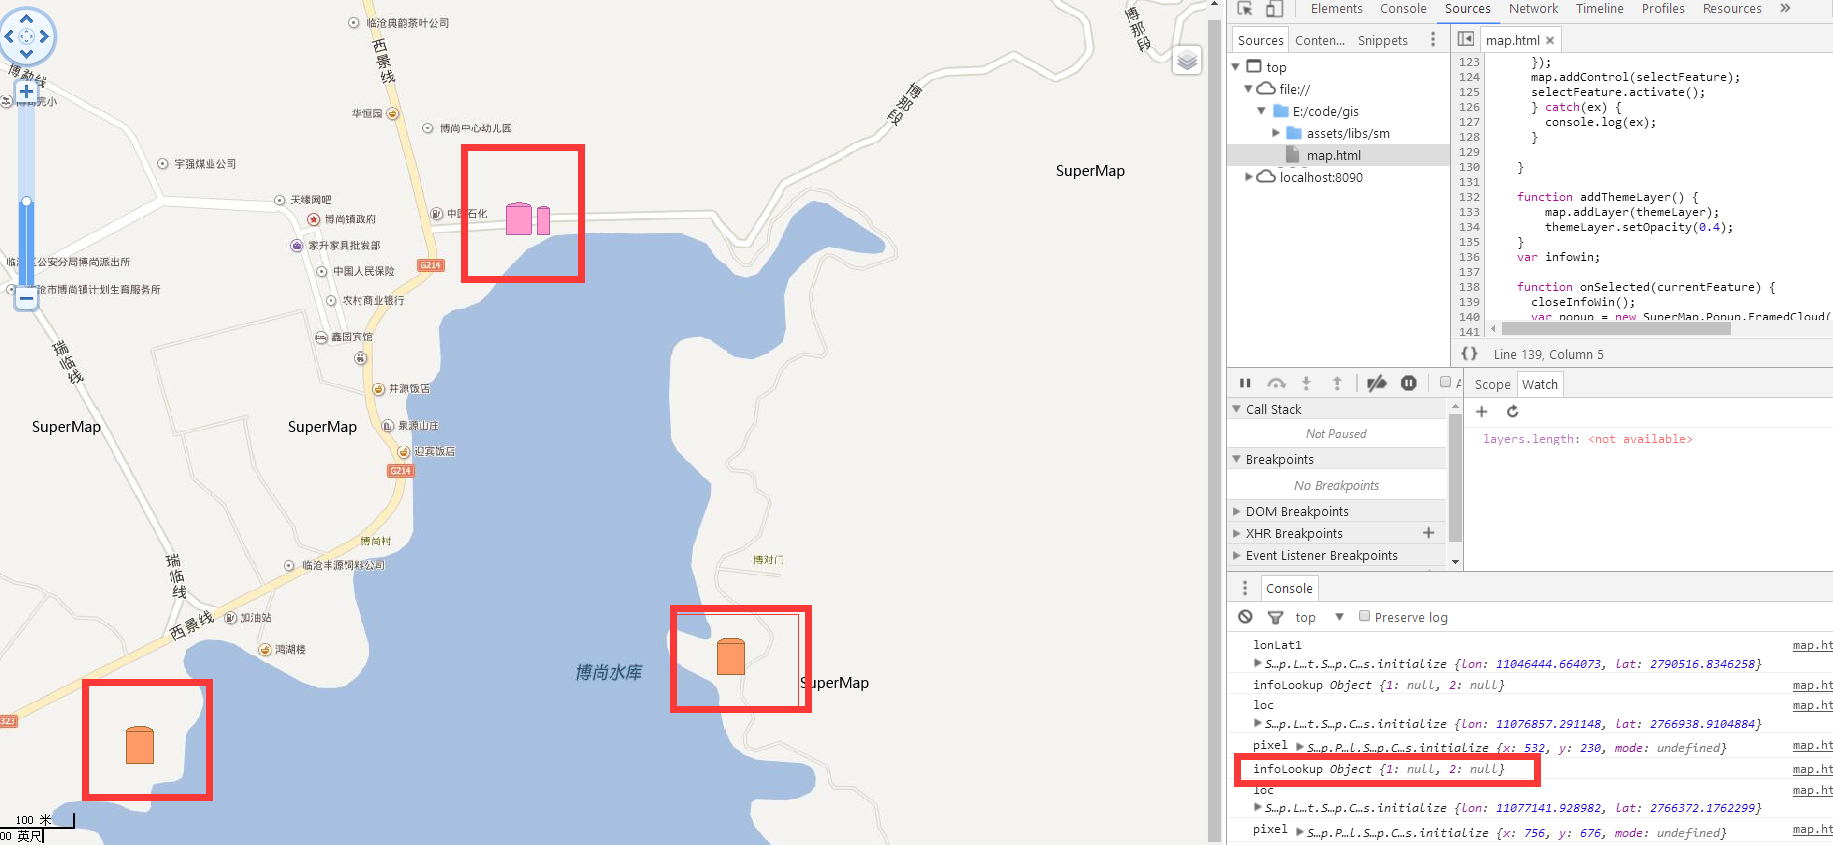
如下图所示:
我的代码:
<!doctype html>
<html lang="en">

<head>
  <meta charset="UTF-8">
  <title>Document</title>
  <script type="text/javascript" src="./assets/libs/sm/libs/SuperMap.Include.js"></script>
  <script type="text/javascript">
    <!--
    //声明变量map、layer、url
    var map, layer, layerImage, vectorLayer, themeLayer, utfgrid,utfgrid2,
      url = ["http://localhost:8090/iserver/services/map-baidu/rest/maps/normal",
        "http://localhost:8090/iserver/services/map-reservoir2/rest/maps/lc@image",
        "http://localhost:8090/iserver/services/map-OSM/rest/maps/normal",
        "http://localhost:8090/iserver/services/map-reservoir2/rest/maps/WatchPoint@data",
		"http://localhost:8090/iserver/services/map-LinCangDiTu/rest/maps/Level17@testB",
		"http://localhost:8090/iserver/services/map-reservoir/rest/maps/isoMap"
      ];
    //创建地图控件
    function init() {
      map = new SuperMap.Map("map", {
        controls: [
          new SuperMap.Control.ScaleLine(),
          //new SuperMap.Control.Zoom(),
          new SuperMap.Control.LayerSwitcher(),
          new SuperMap.Control.Navigation({ //添加导航控件到map
            dragPanOptions: {
              enableKinetic: true //拖拽动画
            }
          })
        ],
        allOverlays: true
      });
      //初始化复杂缩放控件类
      panzoombar = new SuperMap.Control.PanZoomBar();
      // 是否固定缩放级别为[0,16]之间的整数,默认为false
      panzoombar.forceFixedZoomLevel = true;
      //是否显示滑动条,默认值为false
      panzoombar.showSlider = true;
      /*点击箭头移动地图时,所移动的距离占总距离(上下移动的总距离为高度,左右移动的总距离为宽度)
      的百分比,默认为null。 例如:如果slideRatio 设为0.5, 则垂直上移地图半个地图高度.*/
      panzoombar.slideRatio = 0.5;
      //设置缩放条滑块的高度,默认为120
      panzoombar.sliderBarHeight = 180;
      //设置缩放条滑块的宽度,默认为13
      panzoombar.sliderBarWidth = 17;
      map.addControl(panzoombar);


      //创建分块动态REST图层,该图层显示iserver 8C 服务发布的地图,
      //其中"world"为图层名称,url图层的服务地址,{transparent: true}设置到url的可选参数
      layer = new SuperMap.Layer.TiledDynamicRESTLayer("地图", url[4], {
        cacheEnabled: true, transparent: true
      }, {
        maxResolution: "auto"
      });


	utfgrid = new SuperMap.Layer.UTFGrid("雨量站", url[4],
	{
		layerName: "雨量站@testB",
		utfTileSize: 256,
		pixcell: 8,
		isUseCache: true
		},
		{
		utfgridResolution: 8
	});

	utfgrid2 = new SuperMap.Layer.UTFGrid("雨量水位站", url[4],
	{
		layerName: "雨量水位站@testB",
		utfTileSize: 256,
		pixcell: 8,
		isUseCache: true
		},
		{
		utfgridResolution: 8
	});


    layer.events.on({
        "layerInitialized": addLayer
      });

	control = new SuperMap.Control.UTFGrid({
		layers: [utfgrid, utfgrid2],
		callback: callback,
		//handlerMode: "click"
	});
	map.addControl(control);

	function callback(infoLookup, loc, pixel) {
		console.log("infoLookup", infoLookup);
		console.log("loc", loc);
		console.log("pixel", pixel);
		if (infoLookup) {
			var info;
			for (var idx in infoLookup) {
				info = infoLookup[idx];
				if (info && info.data) {
					console.log("infoLookup", infoLookup);
					console.log("loc", loc);
					console.log("pixel", pixel);
				}
			}
		}
	}

      vectorLayer = new SuperMap.Layer.Vector("Vector Layer");

      var callbacks = {
        click: onSelected
      };
      try {
      var selectFeature = new SuperMap.Control.SelectFeature(vectorLayer, {
        callbacks: callbacks
      });
      map.addControl(selectFeature);
      selectFeature.activate();
      } catch(ex) {
        console.log(ex);
      }

    }

	function addThemeLayer() {
		map.addLayer(themeLayer);
		themeLayer.setOpacity(0.4);
	}
    var infowin;

    function onSelected(currentFeature) {
      closeInfoWin();
      var popup = new SuperMap.Popup.FramedCloud("popwin",
        new SuperMap.LonLat(currentFeature.geometry.x, currentFeature.geometry.y),
        null,
        "名称:" + currentFeature.data.NAME + "<br><a href='#'>详细信息</a>",
        null,
        true);
      infowin = popup;
      map.addPopup(popup);
    }

    function closeInfoWin() {
      if (infowin) {
        try {
          infowin.hide();
          infowin.destroy();
        } catch (e) {}
      }
    }

    function callbackFunction(e) {
      console.log(e);

    }

    var inited = false;

    function addLayerImage() {
      map.addLayer(layerImage);
    }

    function addLayer() {
	  map.addLayers([layer, utfgrid, utfgrid2]);
	  themeLayer = new SuperMap.Layer.TiledDynamicRESTLayer("等值专题图", url[5], {
        cacheEnabled: true, transparent: true
      }, {
		  useCanvas: true,
        maxResolution: "auto"
      });
      themeLayer.events.on({
        "layerInitialized": addThemeLayer
      });

      //出图,map.setCenter函数显示地图
      try {
        //var lonLat1 = new SuperMap.LonLat(100.08831, 23.88535);
		var lonLat1 = new SuperMap.LonLat(11046444.664073, 2790516.8346258);
        console.log("lonLat1", lonLat1);

		map.setCenter(lonLat1, 2);

      } catch (ex) {
        console.log("exception ", ex);
      }
    }


    }


    //-->
  </script>
</head>

<body onload="init()">
  <div id="map" style="position:absolute;left:0px;right:0px;width:100%;height:100%;">
  </div>
</body>

</html>